Page Rank
Problem #164
Tags:
graphs
web-related
mathematics
simulation
popular-algorithm
c-1
c-0
When we use some web search engine (like Google), we usually do not care how it arranges the results for our queries.
But this is really very interesting thing. Internet contains billions of pages - if I enter words like Algorithms book - it
tells me that about 19 millions results were found.
But how it cames that the book Introduction to Algorithms by MIT is usually at the first page or even at the first place?
Surely Google does not rely on zounds of workers who manually evaluate each page and assign some importance factor to it.
Instead some automatic process is involved, which calculates "worthness" of the pages depeding on how much outer links lead to it. Some obvious rules could be proposed for such calculation:
- General idea: the page which have more incoming links is more important than another with less amount of links. But surely this may be exploited by cheaters creating many spam pages linking to each other!
- Amendment: the page with few links but from very valuable pages - is also considered important. I.e. if popular mathematical magazine refers to some scientific paper, it is considered to be important paper even if this is the only link leading to it.
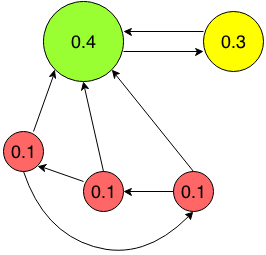
For example, at the picture above three red pages only link to each other, so their value is low. Large green page
is referred to by every other page, so it is very important. At last the yellow page has only one incoming link, but
this link is from a trustworthy page.
So this is the concept of the Page rank metric. And now we'll try to see how assess it numerically.
Basic algorithm
Suppose the user starts from some page and navigates further by randomly choosing any of outgoing links. I.e. starting
from the leftmost red node he randomly goes to rightmost red node, then to green, then to yellow and back to
green.
Page rank is just the probability that the user ends at the given page. I.e. if we drop 100 such random walkers into
our network and make them perform enough steps (say 10 or 30), then at the end we can count how many people are
currently at every page and this will give the page rank value in percents!
Of course it is rather primitive description since, for example, it have no provision against draining all walkers
from nodes or clusters which have no incoming links (like three red nodes in a picture above). Real implementations may
limit number of steps of the walker or introduce some other special limitations.
Your task is to conduct such an experiment with a given web graph. Initially place several walkers (say 10) at each
node (each page) and then for each of them choose some outgoing link and perform transition to other node. Repeat this
several times and output how many people land at each node after that.
Input data contains number N of nodes (pages) in a graph - and then number M of edges (hyperlinks between pages).
Next M lines describe one direct edge each by two values - index of the source and target node (indices are in range 0..N-1).
Answer should contain N integers - i-th value describing how many walkers ended at i-th node.
2.5% is considered OK. You may need to retry few times if your first
submission is not successful.Example:
input data:
6 9
0 1
0 3
0 5
1 3
2 0
3 4
4 0
4 2
5 3

answer:
72 23 37 73 70 25
In this example 50 walkers started from each of 6 pages and continued for about 20 steps.